
We’re finally getting some good longer term bullish momentum on gold, which had been basing for the last few years. A long-spanning base after a correction is good for the long-term health of a bull market.
I’d like to share with you a chart I recently annotated with technical analysis, in the hopes it can help us to understand what’s going on in this fascinating market.
View the full interactive chart yourself here!
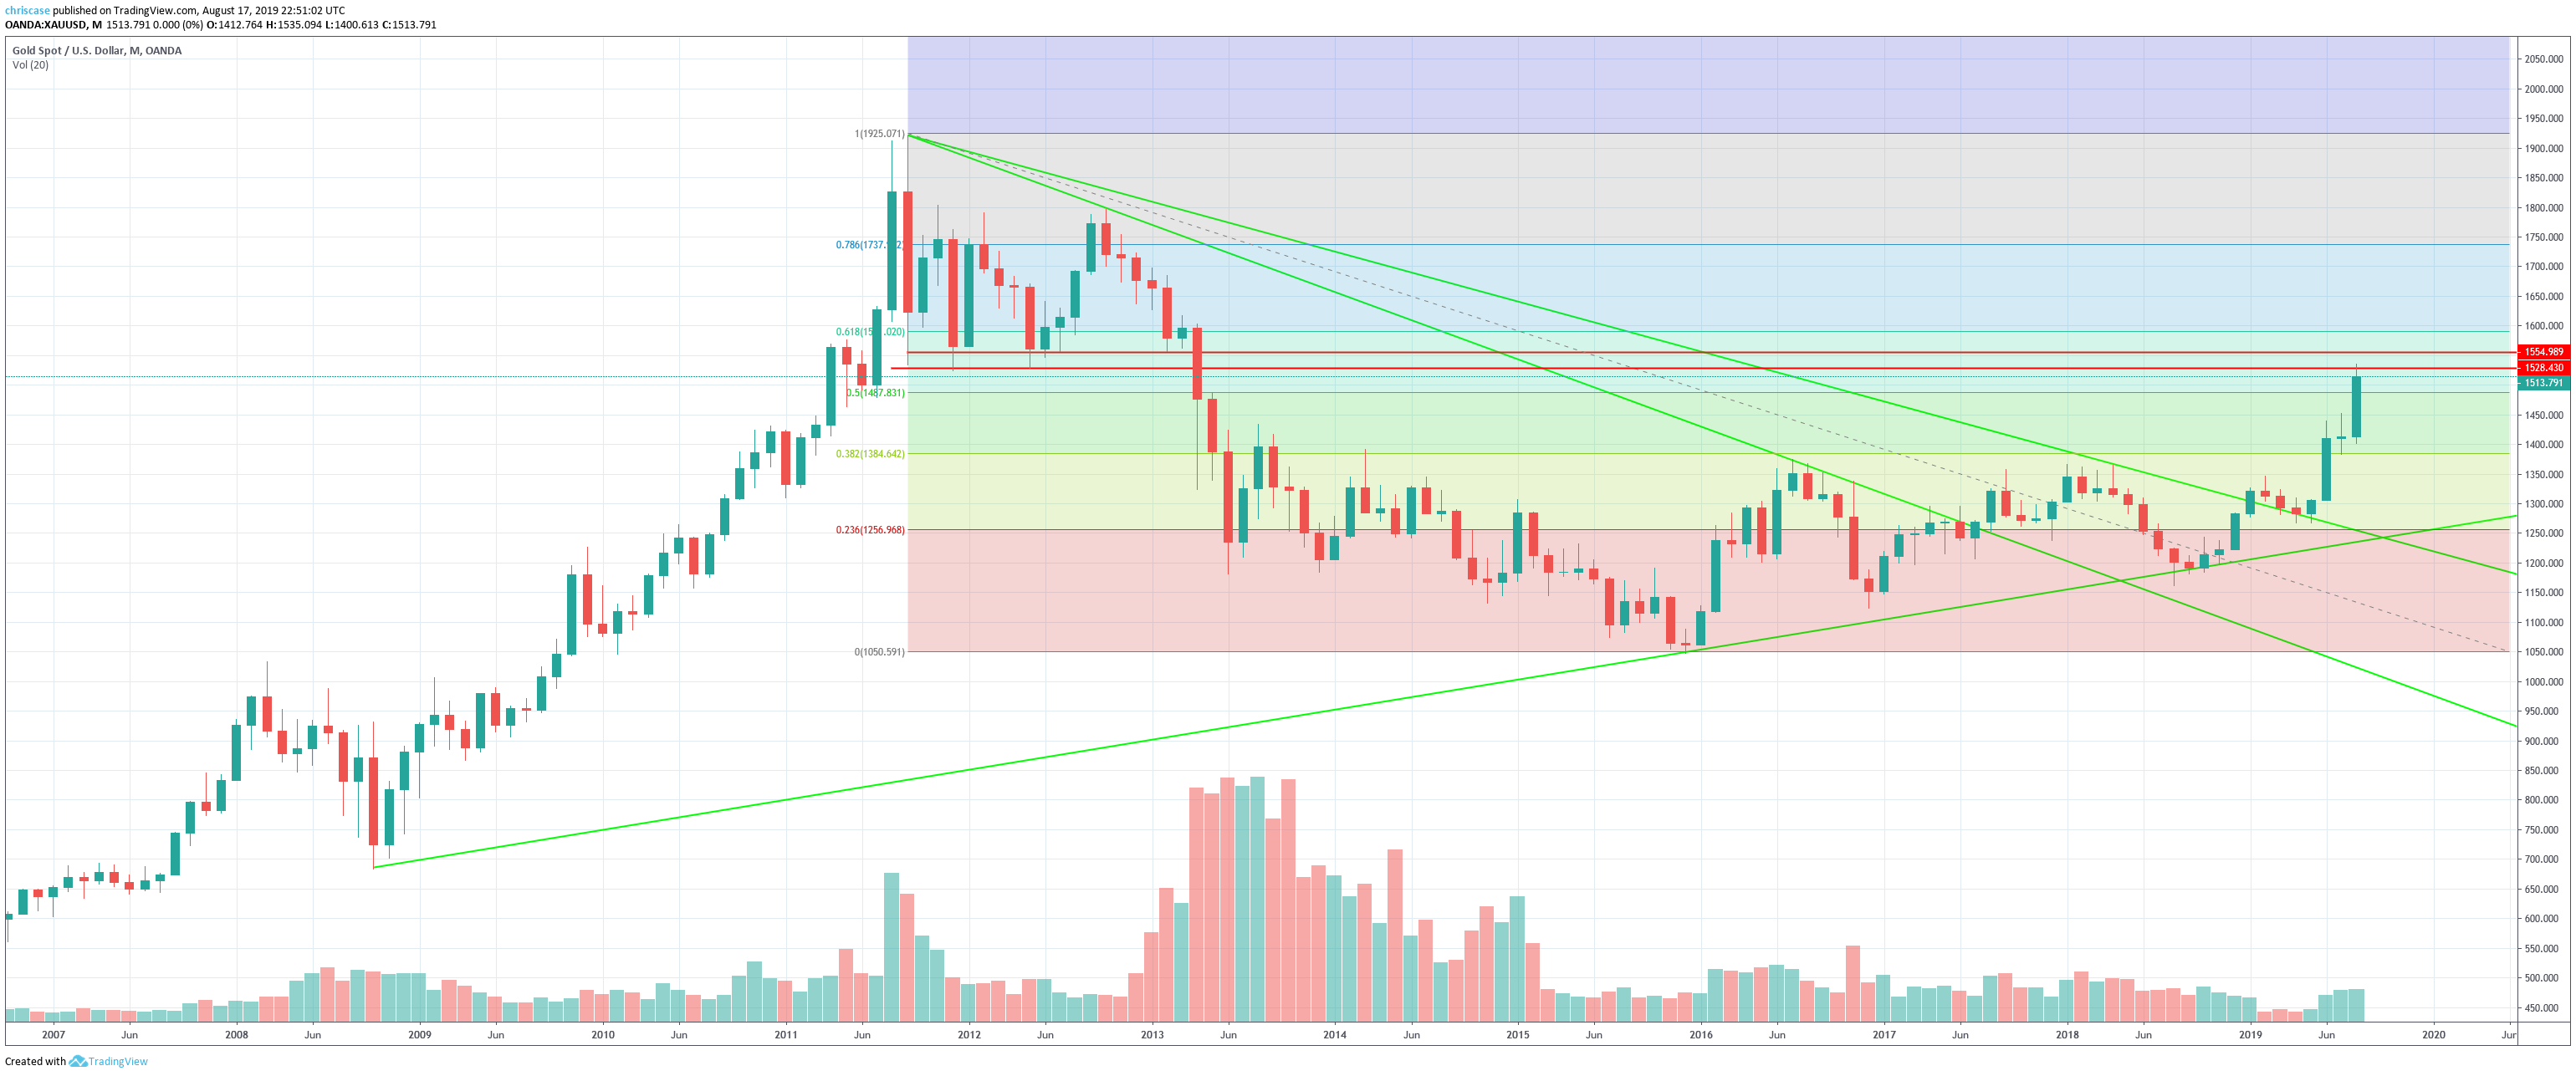
Here we have the longer-term chart, showing gold’s run-up to the $1,900 range and the subsequent correction to $1050. I’ve started by drawing the following:
- longer-term wedge around correction formation (Green Lines)
- Fibonacci retracement levels. (color filled levels)
- Resistance levels (red lines underneath old bottoms – support becomes resistance)
When we zoom in, we can see gold breaking out of the long-term green wedge, bouncing along the top of the wedge and then breaking out to form the channel we have today. It truly is amazing to see how strongly markets respond to trend lines!
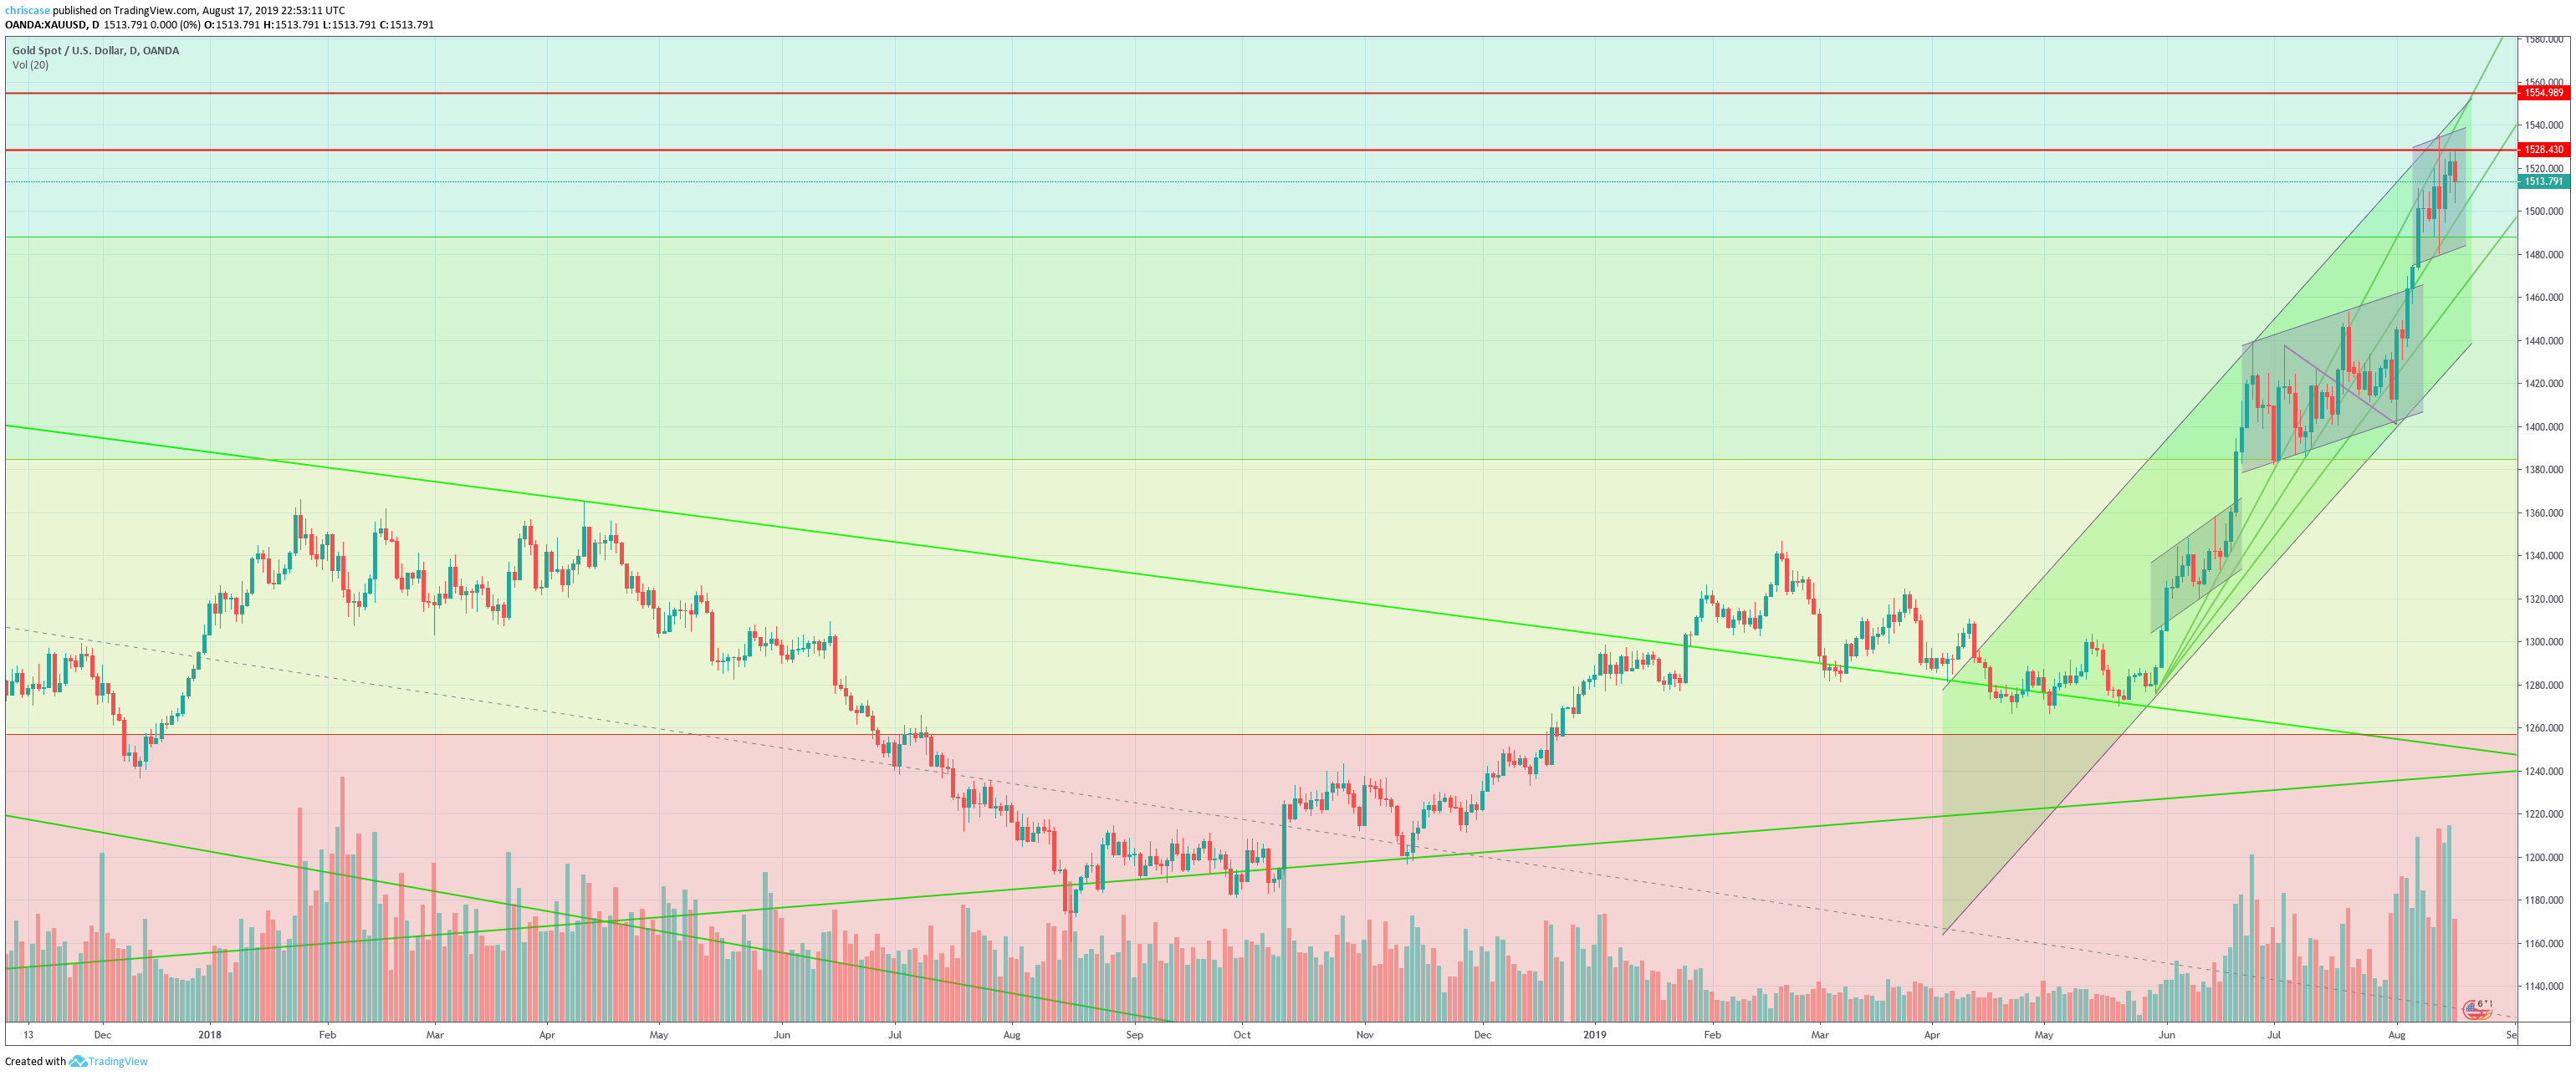
When we continue to zoom in, we can see bullish flags forming stair steps as the channel matures. Each of these stair steps appears to settle on a different level of the long-term Fibonacci’s.
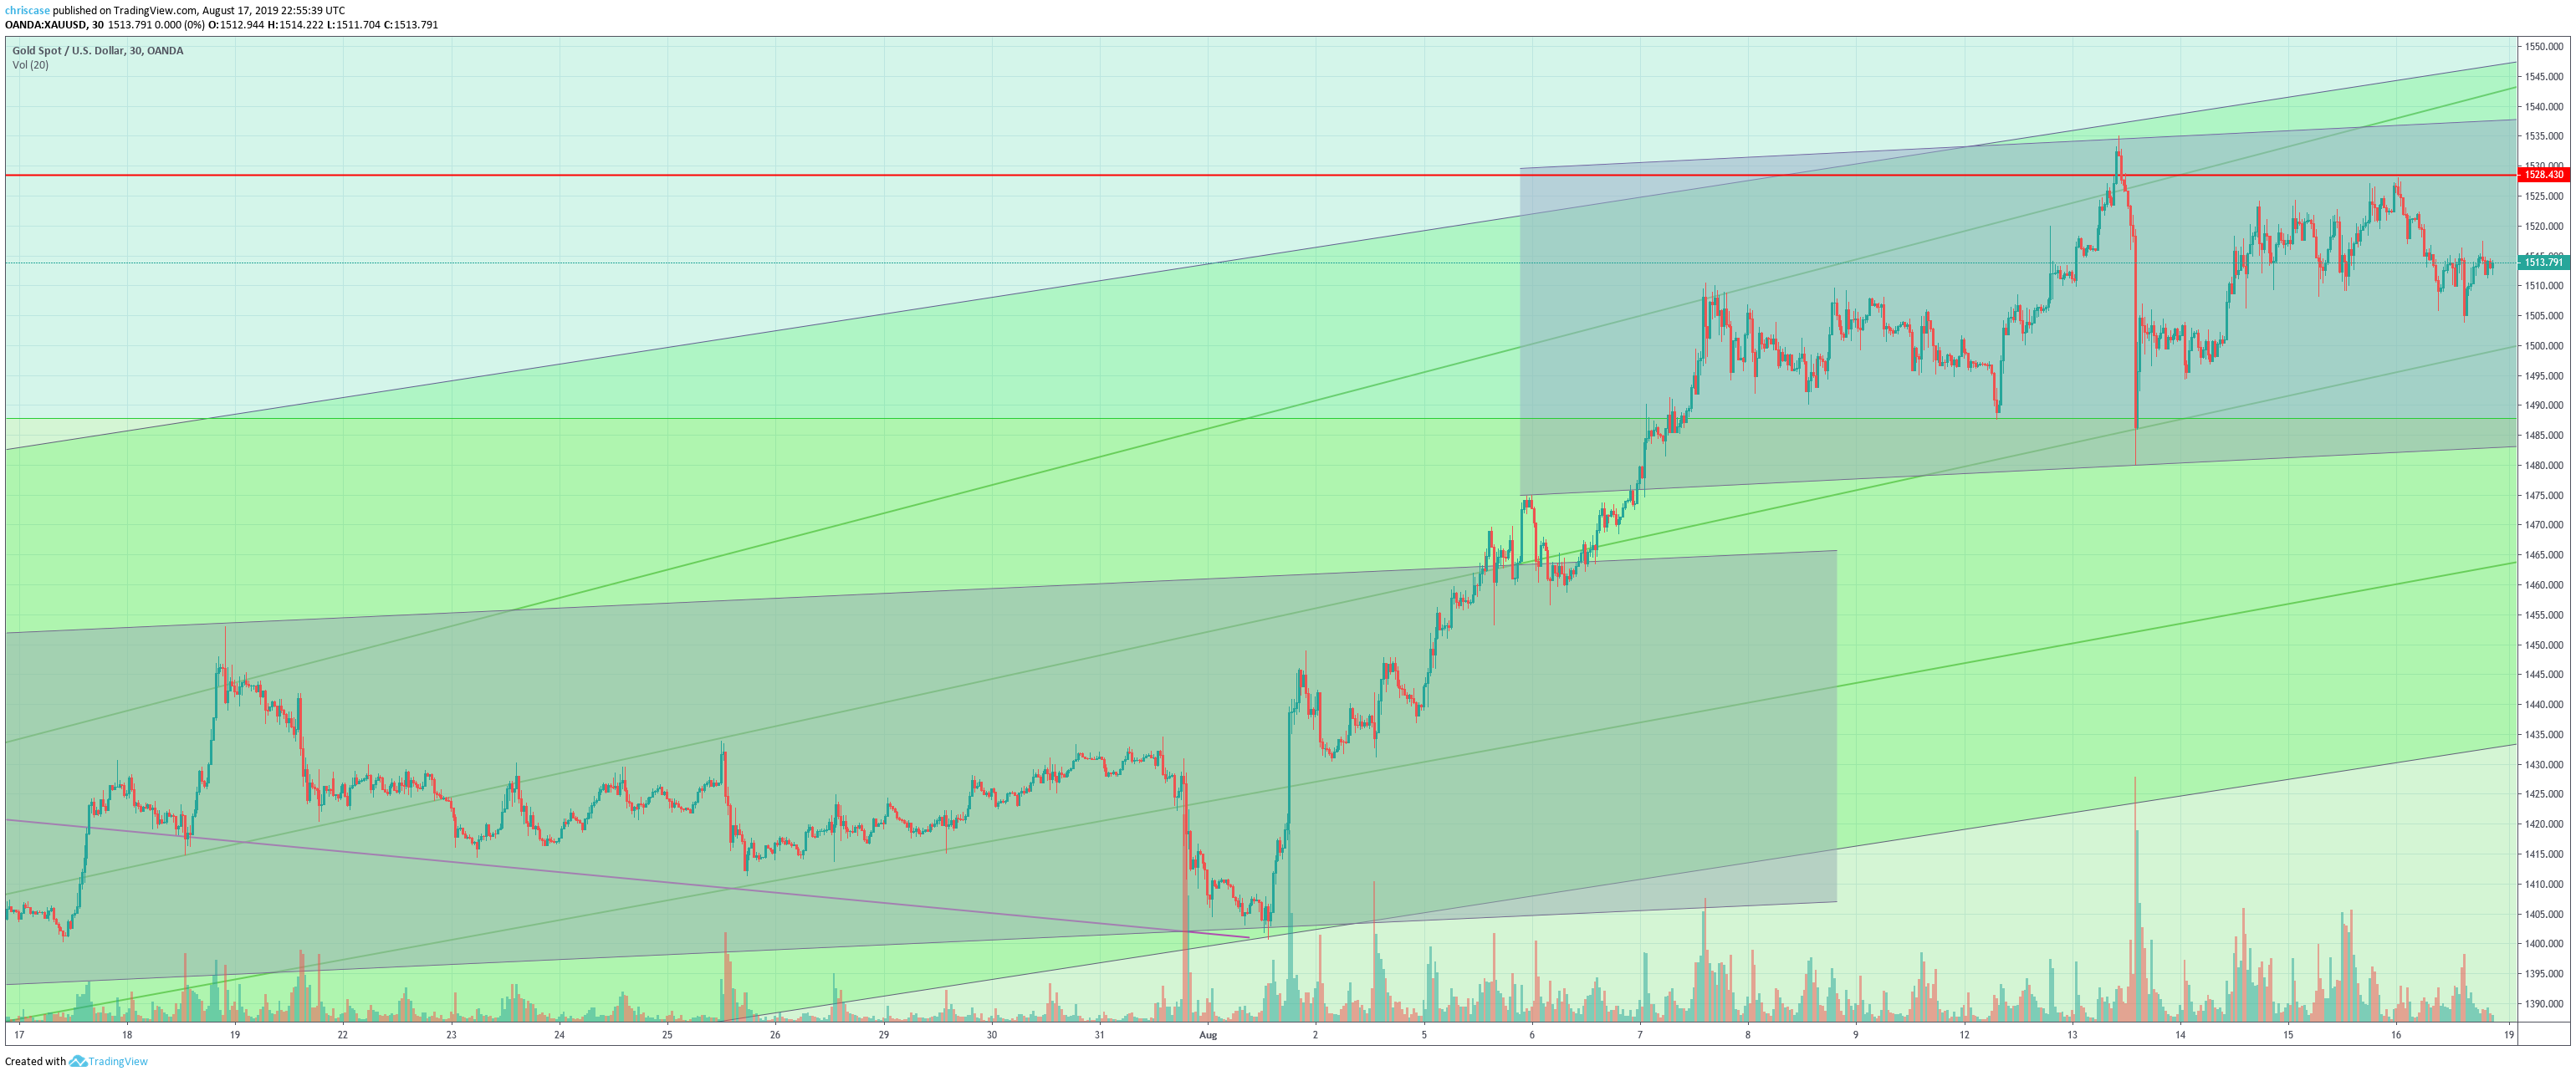
Further into the deep dive, we we reach more towards the present, we can see just how strong the reactions are off the old bottoms which have become overhead resistance. The old resistance levels drew it up like a magnet then repelled it. Yet it continues to test it for the time being.
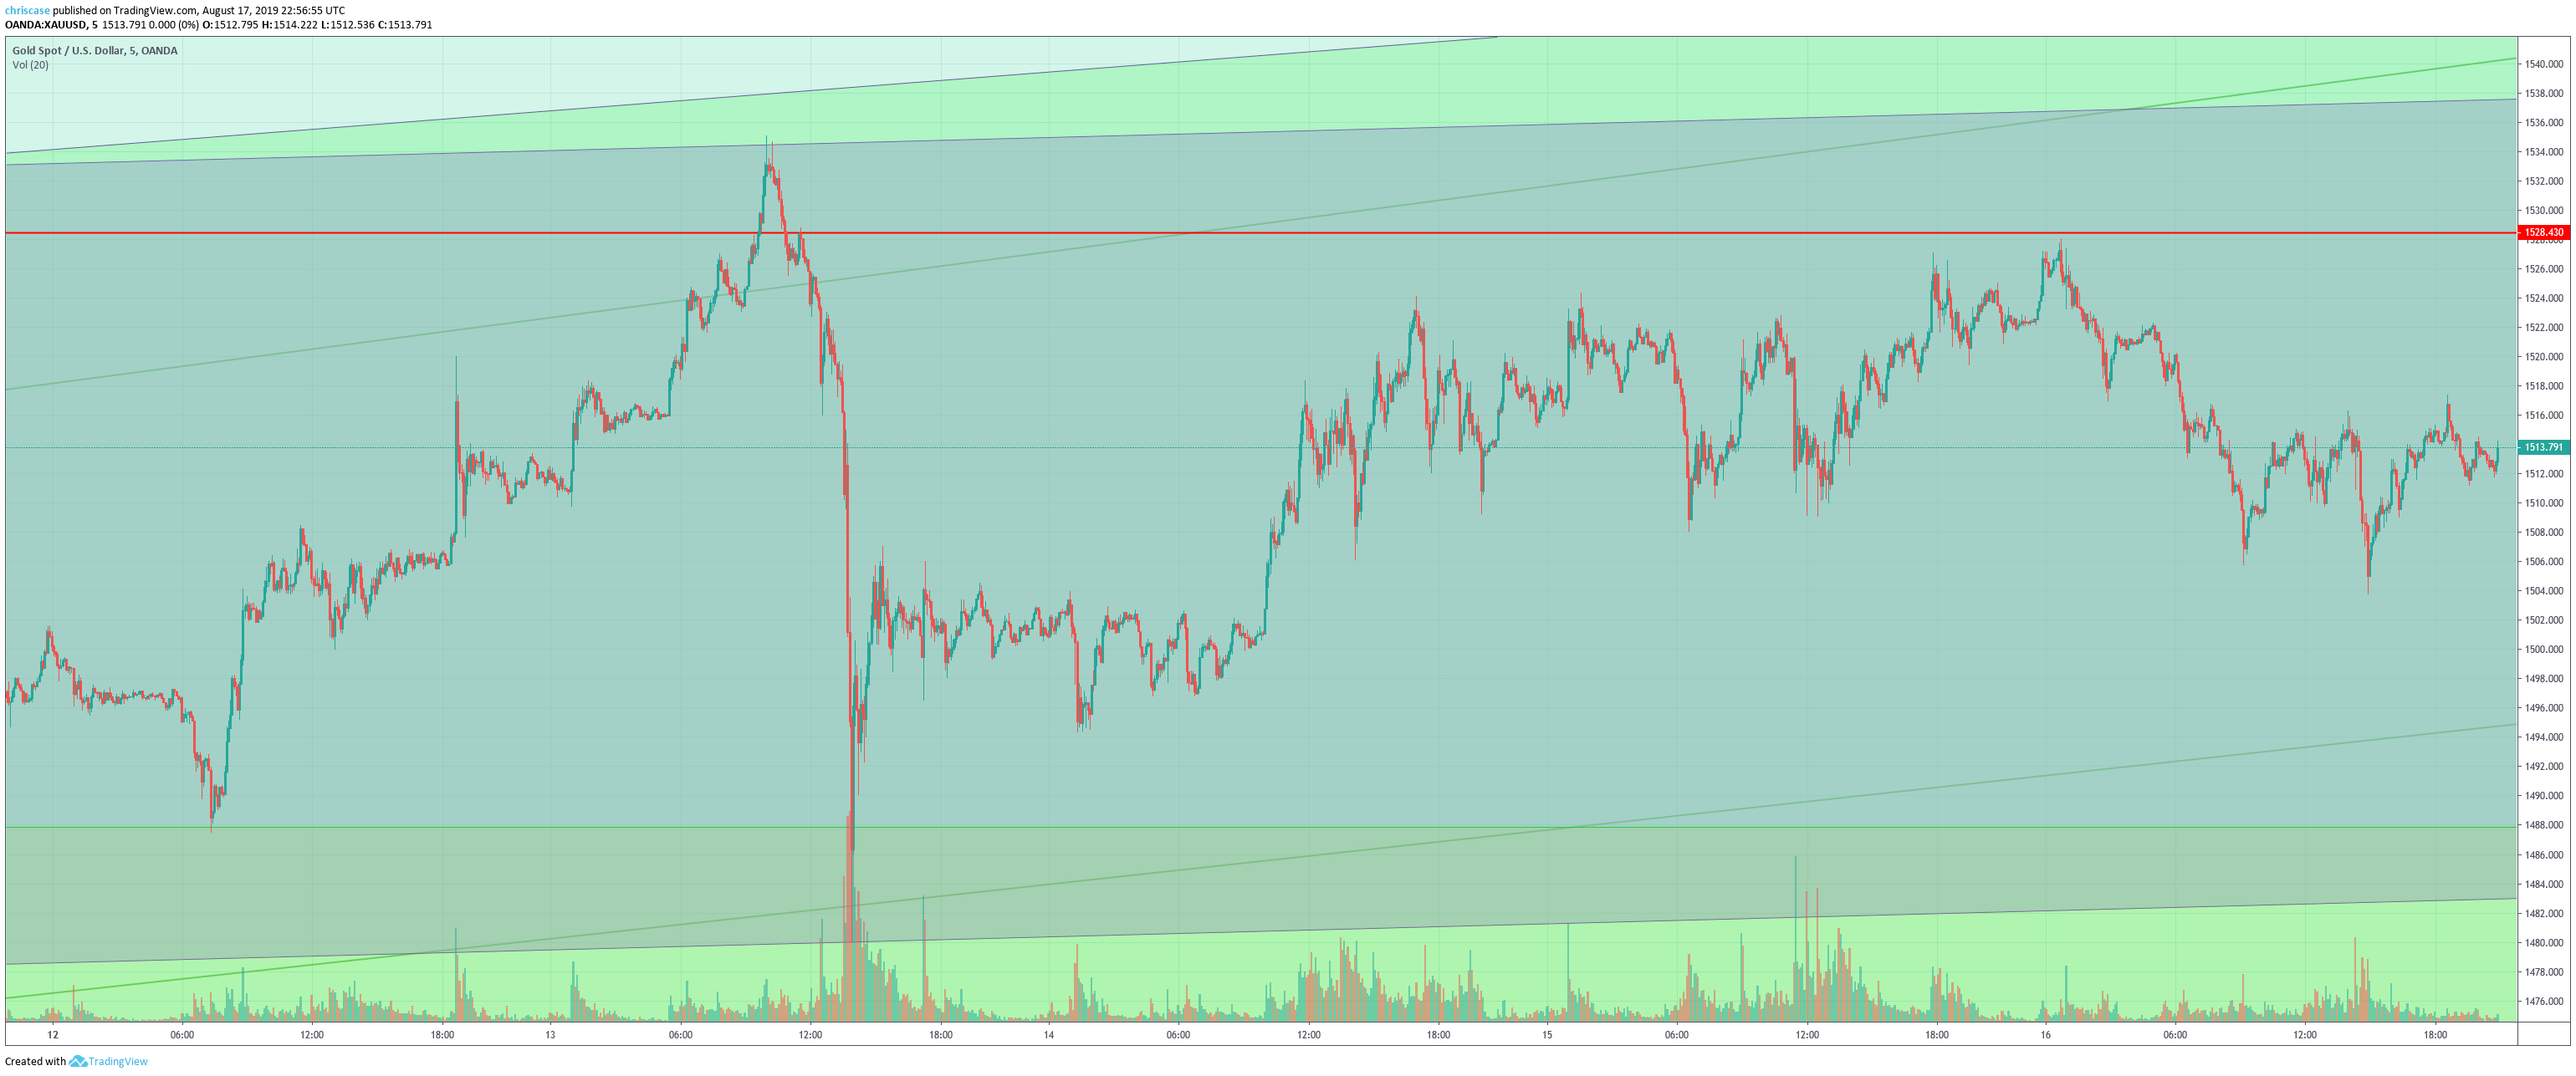
At the final level of zoom, we can see up-close the reaction off the the $1,534 area which dumped all the way to about $1486!
Gold is looking very bullish and while it may correct in the near term, it’s looking like gold will perform very well overall this year. We may very well see a return to the $1,900 range in the near future.