Gold Moves into Uncharted Territory
Posted in Economy on October 7, 2009
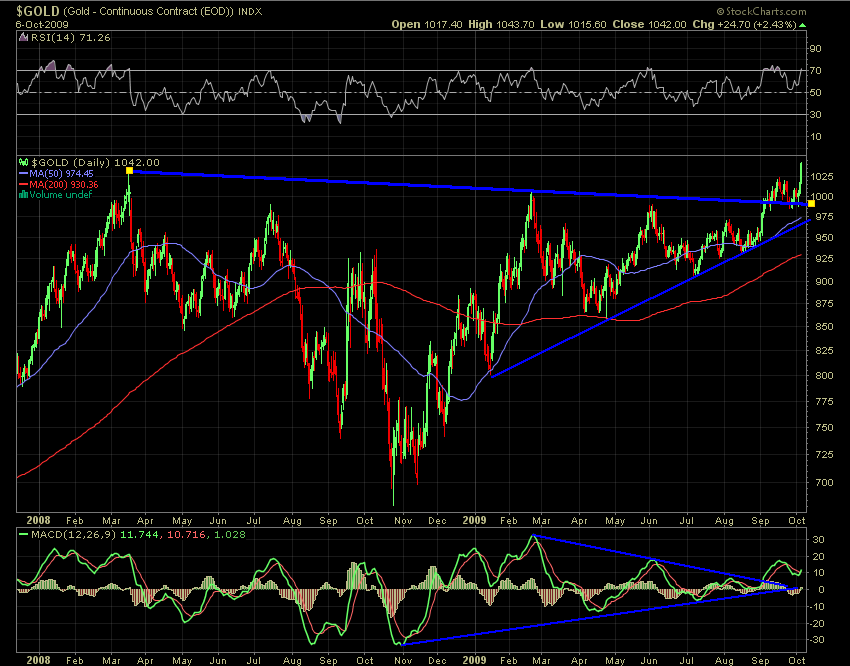
The price of gold has cleared the former all-time high, reaching into the $1040 (USD) range for the first time in the history of the yellow metal. The chart below illustrates how gold formed and broke through a bullish inverted head & shoulders formation, broke through the top of a consolidation wedge, and broke through a wedge in the MACD indicator.
With an RSI reading of 70, gold is one hot commodity. This should start ringing some alarm bells at major money centers around the world. It is becoming ever-more apparent, that we are experiencing a serious rout of inflation which could very well turn into a devastating wave of hyper-inflation in due time.
Tags: Economy, Financial Chart, Gold


Leave a Reply